Category: Strategy

  • Prediction Market Arbitrage: Three Types, Real Math, Thin Margins

    Prediction Market Arbitrage: Three Types, Real Math, Thin Margins

    Prediction market arbitrage looks like free money until you run the numbers with fees included. The concept is straightforward: the same event trades at different prices on different platforms, or the YES and NO sides of a single contract don’t sum to $1.00, and you buy both sides to lock in a guaranteed profit. Researchers at IMDEA Networks Institute found roughly $40 million in arbitrage profits extracted from Polymarket alone over a single year across more than 10,000 markets.1Saguillo et al., “Unravelling the Probabilistic Forest: Arbitrage in Prediction Markets,” arxiv.org, 2025

    But that $40 million went overwhelmingly to automated systems running thousands of simultaneous positions. For a human trader watching a screen, the reality is different. A 4-cent gap on 100 contracts might net $1.38 after platform fees on both sides, and that gap can close before you finish placing the second order.

    This guide breaks prediction market arbitrage into its three distinct types, walks through worked examples with actual fee formulas, and delivers an honest verdict on whether the returns justify the execution overhead. If you have funded accounts on multiple platforms and have noticed price discrepancies, here is exactly what those gaps are worth after every cost is accounted for.

    What Prediction Market Arbitrage Actually Looks Like

    Prediction market arbitrage exploits pricing inefficiencies where the cost of covering all outcomes falls below the guaranteed $1.00 payout.

    Three distinct types exist, each with different execution mechanics, fee profiles, and realistic returns. The math below uses verified fee formulas from Kalshi and Polymarket as of April 2026.

    Cross-Platform Arbitrage: Same Event, Different Prices

    Cross-platform arbitrage occurs when two platforms price the same event differently. You buy the underpriced side on one platform and the opposite side on the other, locking in a guaranteed payout regardless of outcome.

    Worked example (political contract, 100 contract pairs):

    Polymarket Global prices YES at $0.58. Kalshi prices NO on the same event at $0.38. Your combined cost is $0.96 per pair, and exactly one side will pay $1.00.

    Gross profit: $4.00 on 100 pairs ($0.04 per pair).

    Polymarket’s politics taker fee applies: 0.04 x 100 x 0.58 x 0.42 = $0.97.2Polymarket, “Trading Fees,” docs.polymarket.com, 2026 Kalshi’s taker fee applies: round_up(0.07 x 100 x 0.38 x 0.62) = $1.65.3Kalshi, “Fee Schedule,” kalshi.com, February 2026 Total fees across both platforms: $2.62.

    Net profit: $1.38 on a $96 investment, a figure you can model at different trade sizes with a fee calculator. That is a 1.44% return, locked in from the moment both orders fill.

    YES/NO Spread Arbitrage: Same Platform

    Sometimes the YES and NO prices on a single market don’t sum to $1.00. When they sum to less, you buy both and collect the difference at settlement.

    Worked example (Kalshi, 100 contract pairs):

    Kalshi lists YES at $0.47 and NO at $0.48. Combined cost: $0.95 per pair. Gross profit: $0.05 per pair.

    Kalshi charges taker fees on both sides. YES fee: round_up(0.07 x 100 x 0.47 x 0.53) = $1.75. NO fee: round_up(0.07 x 100 x 0.48 x 0.52) = $1.75. Total fees: $3.50.

    Net profit: $1.50 on $95 deployed. A 1.58% return with simpler execution because both legs trade on one platform. These opportunities are rarer and typically smaller than cross-platform gaps, but they eliminate funding and withdrawal timing risk.

    Multi-Outcome Arbitrage

    In markets with three or more outcomes, the individual contract prices sometimes sum to less than $1.00. Buying one contract for every possible outcome guarantees a $1.00 payout on whichever outcome occurs.

    Worked example (three-candidate race on Polymarket, 100 sets):

    Candidate A: $0.45. Candidate B: $0.30. Candidate C: $0.20. Sum: $0.95. You buy all three for $0.95 per set.

    Polymarket’s politics taker fee on each leg: A = 0.04 x 100 x 0.45 x 0.55 = $0.99. B = 0.04 x 100 x 0.30 x 0.70 = $0.84. C = 0.04 x 100 x 0.20 x 0.80 = $0.64. Total fees: $2.47.

    Net profit: $2.53 on $95 invested. A 2.66% return. Single-platform multi-outcome arbitrage carries the lowest fee drag because you pay one platform’s fee structure, not two.

    True Arbitrage vs. Statistical Arbitrage

    The three types above are “true” or textbook arbitrage: you lock in a guaranteed profit regardless of outcome because you hold all sides. The payout is $1.00 no matter what happens. Your only risks are execution (filling both sides before prices move) and settlement (both platforms resolving identically).

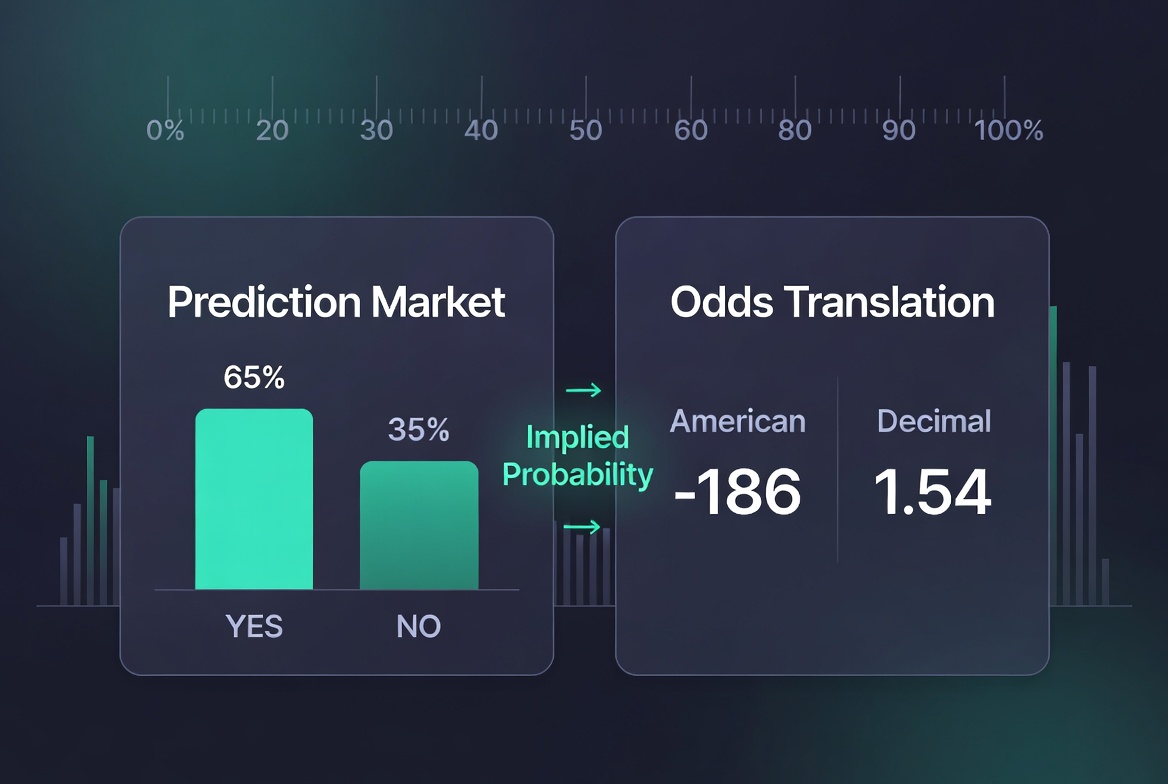
    Statistical arbitrage is different. You believe the market misprices an outcome, so you take a directional position expecting the price to converge toward your estimate. If you think an event has a 65% probability but the contract trades at $0.55, you buy YES expecting the price to rise. This is an EV-positive trade, not a risk-free one. You still bear full event risk: if the outcome goes against you, you lose your entire position.

    Most discussions of “prediction market arbitrage” conflate these two concepts. The distinction matters because true arbitrage requires capital on multiple platforms and speed of execution, while statistical arbitrage requires a probability edge and risk tolerance. The strategies, capital requirements, and risk profiles are fundamentally different.

    TypeWhere It OccursPost-Fee Return (100 contracts)Risk LevelKey Requirement
    Cross-platformSame event, two platforms~1.4% ($1.38)Low (execution risk)Funded accounts on both platforms
    YES/NO spreadSame market, one platform~1.6% ($1.50)Low (execution risk)Speed to capture before correction
    Multi-outcomeMulti-candidate market~2.7% ($2.53)Low (execution risk)Monitoring multi-outcome markets
    StatisticalAny mispriced contractVariableHigh (event risk)Probability edge over the market

    Why Price Gaps Exist Between Prediction Platforms (and Why They’re Shrinking)

    Price discrepancies between Polymarket and Kalshi are not glitches. They reflect structural differences in who trades on each platform and how money moves between them.

    Polymarket’s global platform attracts crypto-native users who fund accounts with USDC and are comfortable with wallet-based infrastructure. Kalshi draws US retail traders who deposit via ACH or debit card and expect a traditional exchange interface. These populations process information differently, react to events on different timelines, and carry different biases.

    A political event that moves Polymarket prices in seconds may take minutes to reflect on Kalshi if Kalshi’s user base is less engaged with that category, or vice versa for economic data releases where Kalshi’s audience skews more attentive.

    Funding friction amplifies the gap. Moving money onto Polymarket requires acquiring USDC, while Kalshi accepts bank transfers and PayPal. A trader who spots a cross-platform gap cannot exploit it without pre-funded accounts on both sides, and the deposit clearing time alone (ACH on Kalshi can take 3 to 5 business days for new deposits) means the opportunity will close long before the capital arrives.

    These gaps are shrinking. Researchers documented roughly $40 million in arbitrage profits extracted from Polymarket between April 2024 and April 2025, with 86 million bets analyzed across more than 10,000 markets.4Saguillo et al., “Unravelling the Probabilistic Forest: Arbitrage in Prediction Markets,” arxiv.org, 2025 The top three wallets alone captured approximately $4.4 million in combined profits.

    That level of automated capital actively compresses spreads. Cross-platform monitoring tools like the market scanner now make discrepancies visible to anyone, and the Polymarket and Kalshi price gaps that once persisted for hours on low-volume markets now close in minutes on anything with meaningful liquidity. Arbitrage still exists, but the window is narrower every quarter.

    What You Need Before Attempting Prediction Market Arbitrage

    Cross-platform arbitrage requires infrastructure in place before the opportunity appears. By the time you spot a price gap, fund an account, and complete KYC, the spread will have closed.

    Pre-Funded Accounts on Multiple Platforms

    Kalshi requires full identity verification before trading, with KYC taking roughly 2 to 5 minutes, but deposits via ACH can take 3 to 5 business days to clear.

    Polymarket’s global platform uses wallet-based onboarding without KYC: you connect or create a Web3 wallet funded with USDC, which means you need an exchange account or on-ramp already set up.

    The US platform (Polymarket US) requires full identity verification through an intermediary. Complete the setup, fund both accounts, and let deposits settle before you start monitoring for gaps.

    Capital Allocation Across Platforms

    Arbitrage requires buying on both sides simultaneously. If your capital sits entirely on Kalshi, a Polymarket opportunity is useless. Split your working capital across the platforms you monitor, and accept that some portion will sit idle between opportunities.

    Fee Formula Literacy

    Both platforms use probability-weighted fee formulas, not flat percentages. A 5-cent gap on a contract priced at $0.50 generates higher fees than the same gap at $0.90 because fees peak at midpoint probability. Running the numbers before you trade is the difference between a net positive and a net loss.

    Resolution Criteria Alignment

    “Will Bitcoin hit $100,000 by December 31” on Kalshi may settle using a different price source than what appears to be the same question on Polymarket. If one platform resolves YES and the other resolves the equivalent contract as NO because they use different data feeds, your “risk-free” arbitrage becomes a total loss on one leg. Compare resolution criteria word for word before committing capital.

    Expert Tip

    Fund both accounts before you start monitoring for opportunities. Transferring money after you spot a gap means the gap will close before your deposit clears. Treat the funding step as infrastructure, not as part of the trade.

    The Real Cost-Benefit of Manual Prediction Market Arbitrage

    The Numbers After ALL Costs

    The worked examples in this article show post-fee returns of 1.44% (cross-platform), 1.58% (YES/NO spread), and 2.66% (multi-outcome). Those percentages sound reasonable until you attach dollar amounts to realistic position sizes.

    At $200 deployed across two platforms, a 1.5% return is $3. At $500, it is $7.50. At $1,000, it is $15.

    Each of those returns assumes you found the opportunity, executed both legs before the gap closed, and waited for the event to resolve. The capital is locked until resolution, which could be days, weeks, or months depending on the contract. You cannot recycle that money into the next opportunity while it sits in an open position.

    Annualizing these returns requires a constant pipeline of opportunities. The IMDEA study found arbitrage across more than 10,000 Polymarket markets, but the vast majority of profitable gaps were captured by automated systems executing thousands of positions simultaneously. The top three wallets placed over 10,200 bets during the study period.5Saguillo et al., “Unravelling the Probabilistic Forest: Arbitrage in Prediction Markets,” arxiv.org, 2025 A manual trader checking prices twice a day is competing against systems that check prices every second.

    Who Actually Profits

    The $40 million in documented arbitrage profits was not distributed evenly.6DL News, “Polymarket Users Lost Millions to ‘Bot-Like’ Bettors,” dlnews.com, 2025 Three wallets captured roughly $4.4 million combined. The researchers classified hundreds of users as arbitrage participants, but the profit concentration mirrors the smart money signals pattern: a small number of sophisticated, automated participants extract the majority of available value.

    For a manual trader, the honest math looks like this: you will occasionally find a gap worth $5 to $20 on a few hundred dollars of capital. The gap will sometimes close before you execute the second leg. Fees will sometimes eat the remaining margin. The strategy works in theory and in code. It rarely works at scale with a browser and a phone.

    In a recent cross-platform arbitrage play on a political contract. Polymarket had YES at $0.58, Kalshi had YES at $0.67, which meant I could buy Polymarket YES and Kalshi NO ($0.33) for a combined $0.91 and collect $1.00 regardless of outcome. In theory, that is $0.09 profit per contract. In practice, by the time I funded both positions, Polymarket moved to $0.62. The gap shrank to $0.05. After fees on both platforms, net profit was roughly $0.02 per contract. On $200 deployed across both platforms, that is $4 for about 30 minutes of work. The math works. The margins just rarely survive the execution window.

    Robert C.

    Warning

    A 4-cent gap that takes 30 minutes to execute at $200 scale produces roughly the same hourly return as minimum wage. Prediction market arbitrage rewards speed and scale. Without both, the returns are educational, not financial.

    Risks That Fee Calculators Don’t Show

    Fee drag is the most visible cost of prediction market arbitrage, but it is not the only one. Several risks operate outside fee formulas and can turn a seemingly locked-in profit into a loss.

    Price Convergence During Execution

    Cross-platform arbitrage requires filling two orders on two separate platforms. If you buy YES on Polymarket at $0.58 and the price moves to $0.61 before you place the corresponding NO order on Kalshi, your cost basis has changed and the gap may no longer be profitable. On liquid markets, this window can close in under a minute. On illiquid markets, the spread itself may widen when your order hits the book.

    Resolution Criteria Mismatch

    This is the most underappreciated risk in cross-platform arbitrage. Two platforms may list what appears to be the same event but define resolution differently, a risk the platform comparison highlights by mapping resolution sources for each exchange. Kalshi resolves many contracts using Associated Press or government data agency calls, while Polymarket’s global platform uses the UMA Optimistic Oracle.

    If a disputed event leads one platform to resolve YES and the other to resolve the economic equivalent as NO, you lose on one leg without winning on the other. This is not theoretical. Resolution disputes have occurred on political and financial contracts where the precise wording of the question differed between platforms.

    Capital Lockup and Opportunity Cost

    Arbitrage capital is frozen from the moment you enter both positions until the event resolves. A political contract that resolves in November locks your capital for months. During that time, the same money could be deployed in higher-return directional trades, assuming you are evaluating a contract with a genuine probability edge.

    Withdrawal Timing Asymmetry

    Polymarket global withdrawals process in minutes (USDC on Polygon). Kalshi ACH withdrawals typically take a few business days. If you need to rebalance capital across platforms after a position resolves, the faster platform’s funds arrive first, creating a window where your capital is split and neither side is fully funded for the next opportunity.

    Pro Tip

    Before entering any cross-platform position, compare resolution criteria word by word. “Will Bitcoin reach $100,000 by December 31” on Kalshi may use a different price source and cutoff time than what appears to be the same question on Polymarket.

    The Arbitrage Mindset Without the Arbitrage Overhead

    Understanding arbitrage dynamics makes you a sharper prediction market trader even if you never execute a pure arbitrage trade. The practice of comparing the same event across Polymarket and Kalshi reveals which platform offers better pricing for a given position, how fee structures affect real returns, and where liquidity concentrates by market category.

    Cross-platform price monitoring is valuable even without arbitrage execution. If Polymarket prices a political outcome at $0.55 and Kalshi prices it at $0.60, that 5-cent gap tells you something about participant composition and information flow. It also tells you which platform is offering you the better entry point for a directional trade you were going to make anyway.

    The market scanner approach converts arbitrage awareness into practical edge: use cross-platform visibility to find better prices, not necessarily to lock in both sides. For most traders, that informational edge is worth more than the thin margins of manual arbitrage execution.

    Sources & References

    • 1
      Saguillo et al., “Unravelling the Probabilistic Forest: Arbitrage in Prediction Markets,” arxiv.org, 2025
    • 2
      Polymarket, “Trading Fees,” docs.polymarket.com, 2026
    • 3
      Kalshi, “Fee Schedule,” kalshi.com, February 2026
    • 4
      Saguillo et al., “Unravelling the Probabilistic Forest: Arbitrage in Prediction Markets,” arxiv.org, 2025
    • 5
      Saguillo et al., “Unravelling the Probabilistic Forest: Arbitrage in Prediction Markets,” arxiv.org, 2025
    • 6
      DL News, “Polymarket Users Lost Millions to ‘Bot-Like’ Bettors,” dlnews.com, 2025
  • How to Spot Smart Money Signals in Prediction Markets: A Whale Tracking Guide

    How to Spot Smart Money Signals in Prediction Markets: A Whale Tracking Guide

    Smart money moves prediction markets before the news does, and if you have tracked sharp action on a sportsbook, you already understand the core mechanic.

    In sports betting, sharps are the small minority of bettors whose wagers move lines. Prediction markets have an equivalent: large, informed traders whose positions shift contract prices hours or days before consensus catches up. The difference is transparency. On Polymarket, every trade is recorded on the Polygon blockchain, which means you can watch these traders in real time rather than inferring their presence from line movement alone.1Polymarket, “Platform Overview,” polymarket.com, April 2026

    This guide breaks down the six smart money signals that matter in prediction markets, explains how each one maps to a sports betting concept you already know, and gives you a practical framework for deciding when to follow, when to fade, and when to do nothing. We also cover the limitations honestly, because whale tracking tools sell the signal without mentioning how often smart money is wrong.

    What “Smart Money” Means in Prediction Markets (and Why Sports Bettors Already Understand It)

    If you have ever tracked reverse line movement on a sportsbook, you already know what smart money looks like. The line moves against the popular side because a handful of respected bettors put down enough to outweigh thousands of small wagers.

    Prediction markets work the same way, with one critical structural difference: on crypto-native platforms like Polymarket, every trade is tied to a wallet address with a public performance history, which means you can track specific traders rather than guessing at who moved the price.In sports betting, “sharp action” is inferred. You watch for steam moves (sudden, widespread line shifts), reverse line movement (the line moving against the majority of tickets), and line freezes (heavy public action absorbed without price change).

    The way prediction market odds reflect information is structurally similar, but the data is richer because blockchain settlement exposes individual wallets. Because exchange prices differ structurally from sportsbook lines, the smart money signals you see in each venue take different forms.2VSiN, “Interpreting Line Movement to Locate Sharp Action,” vsin.com, January 2026

    Sports Betting TermPrediction Market Equivalent
    Sharp actionWhale trade / leaderboard trader activity
    Reverse line movementPrice moves against volume direction
    Steam moveRapid price shift across related contracts
    Line freezeHigh volume absorbed, no price change
    Bet vs. dollar splitPublic ticket count vs. USDC volume
    Late sharp actionLarge trades near contract resolution

    The taxonomy matters because smart money in prediction markets is not one signal. It is at least six distinct patterns, each with different reliability and different implications for how you should respond.

    The Six Smart Money Signals and How to Read Each One

    SignalSports AnalogHow to Spot ItReliability
    Contrarian whale tradeSharp RLM betLeaderboard trader buys unpopular sideHigh
    Volume spike (no news)Unusual handle300%+ volume surge, no catalystMed-High
    Price-volume divergenceReverse line movementPrice drifts opposite to volumeMed-High
    Multi-whale convergenceMultiple steam moves3+ top-100 wallets, same position, 48hHigh
    Late large tradeLate sharp actionLarge trade 24-72h before resolutionMedium
    Order book absorptionLine freezeHigh volume absorbed, price unchangedMedium

    Not every large trade is smart money. A whale dumping $500,000 on a 90-cent prediction market contract near resolution is collecting pennies, not signaling an edge.

    The signals that matter are the ones where the trade size, timing, and context suggest the trader knows something the current price does not reflect.

    1. Large contrarian trades from proven wallets.

    A top-100 leaderboard trader buying YES at $0.30 on a consensus-NO contract is the single highest-conviction signal. The trader’s historical P&L is public, the position is against the crowd, and the size relative to the market’s open interest is meaningful.

    Reliability: High.

    2. Volume spikes without a news catalyst.

    When a contract’s 24-hour volume surges 300-500% and no public news explains it, informed capital is positioning ahead of something. Cross-reference the spike with social media and news feeds. If you find nothing, the volume itself is the signal.

    Reliability: Medium-high.

    3. Price-volume divergence.

    The price drifts slowly from $0.55 to $0.50 while volume doubles. This mirrors reverse line movement in sports betting: the visible flow says one thing, but the money says another. Someone with size is accumulating on the unpopular side.

    Reliability: Medium-high.

    4. Convergence of multiple proven wallets.

    When three or more top-100 traders independently enter the same position within a 48-hour window, the signal compounds. One whale could be wrong. Three whales arriving independently is harder to dismiss, because independent agreement from differently-sourced information is the foundation of how prediction markets work.

    Reliability: High.

    5. Late large trades near resolution.

    Sharp sports bettors hit the market late when limits are highest. Similarly, large prediction market trades in the final 24-72 hours before a contract resolves carry disproportionate signal weight, because the trader is accepting minimal time for the market to move in their favor and maximum information about the likely outcome.

    Reliability: Medium (context-dependent; could also be informed insiders).

    6. Order book absorption.

    On platforms with visible order books, watch for sustained buying that the book absorbs without price change. This is the prediction market equivalent of a line freeze: someone is selling into the buying (or vice versa) at scale, suggesting a large counterparty disagrees with the direction of retail flow.

    Reliability: Medium.

    The key distinction from sports betting: prediction markets give you wallet-level data. You do not need to infer sharp action from line movement. On Polymarket, you can identify the trader, check their P&L history, verify their category specialization, and assess whether this trade fits their pattern.

    Why Polymarket Enables Whale Tracking and Kalshi Doesn’t (It’s About Trader Attribution, Not Data)

    The quality of your smart money analysis depends entirely on how much the platform reveals, and the gap between Polymarket and Kalshi is structural, not cosmetic.

    Polymarket settles every trade on the Polygon blockchain. Every wallet address, position size, entry price, and trade timestamp is permanently recorded and publicly queryable.

    An ecosystem of third-party tools has built on this transparency: Unusual Whales’ “Unusual Predictions” launched in January 2026 to extend its stock and options surveillance to Polymarket whales.3Finance Magnates, “Unusual Whales Extends Insider Radar to Prediction Markets,” financemagnates.com, January 2026 PolymarketScan offers a free API with leaderboard data, whale trade alerts, and wallet PnL timeseries.

    Forqast provides whale alerts with insider detection and AI trade signals. Hashdive offers smart money scoring with convergence alerts when multiple top wallets align on the same position. FlowFrame surfaces order book depth data alongside whale activity monitoring. The Polymarket native leaderboard at Polymarket’s leaderboard lets you filter top traders by monthly profit, all-time profit, and volume across categories.

    Kalshi publishes more data than most traders realize. Its public API exposes every executed trade with price, quantity, taker side, and timestamp, and per-market volume and open interest are accessible without authentication.4Kalshi, “API Documentation: Get Trades,” docs.kalshi.com, April 2026 The kalshi.com/trade-data page surfaces this in real time. Kalshi also has a leaderboard at kalshi.com/social/leaderboard where opted-in users are ranked by profit across daily, weekly, monthly, and all-time windows.5Kalshi, “Leaderboard,” help.kalshi.com, April 2026

    Where Kalshi differs from Polymarket is depth of trader attribution. On Kalshi, trades are anonymous: you can see that 500 contracts moved at $0.65, but you cannot identify the account behind the trade. The leaderboard shows who is profitable, but not what they bought, when, or at what price.

    On Polymarket, every trade is tied to a wallet address. You can click a top-100 leaderboard trader, see every position they hold, trace their entry prices, check their win rate by category, and assess whether a new trade fits their historical pattern. That granularity is what makes Polymarket the stronger platform for smart money analysis, even though Kalshi’s overall data transparency is more robust than its reputation suggests.

    Data VisibilityPolymarket (Global)Kalshi
    Individual trade dataPublic (on-chain, wallet-attributed)Public (API, anonymous)
    Trader identityPseudonymous but trackableAnonymous (no attribution)
    Historical trader P&LPublic (leaderboard + on-chain)Opt-in leaderboard (profit only)
    Per-market volumeVisible on-chainPublic (API + trade data page)
    Order book depthOn-chain (via tools)Public (CLOB, API)
    Whale tracking tools10+ third-party toolsAggregate only (no trader ID)

    This does not make Kalshi a black box. Kalshi’s trade data, order book, and volume are all publicly accessible, and its CFTC regulation, segregated funds, and fee cap of $0.02 per contract offer protections that Polymarket’s global platform does not.6Kalshi, “Fee Schedule,” kalshi.com/docs/kalshi-fee-schedule.pdf, February 2026 Polymarket’s category-dependent fees on the global platform range from 0.75% (sports) to 1.80% (crypto), which affects the net profitability of any whale-following strategy.7Polymarket, “Trading Fees,” docs.polymarket.com/trading/fees, March 2026 

    But for smart money analysis specifically, the gap is trader attribution. Only Polymarket lets you identify who traded, check their record, and build a thesis around their positioning.

    When Smart Money Gets It Wrong: Survivorship Bias, Oracle Manipulation, and the Limits of Whale Tracking

    Whale tracking tools sell the signal. They do not sell the failure rate. Before you build a strategy around following smart money, you need to understand how often it fails and why.

    The leaderboard is a survivorship filter.

    Polymarket’s leaderboard ranks traders by profit. Traders who blew up disappear. The ones who remain look brilliant, but their displayed win rates are inflated. A PANews analysis of 27,000 transactions from the ten most profitable Polymarket whales in December 2025 found that true win rates were meaningfully lower than historical averages once “zombie orders” (open but inactive positions) were stripped out.

    One top trader, SeriouslySirius, showed a historical win rate that dropped to approximately 53% after adjustment.8PANews, “In-depth analysis of 27,000 trades by Polymarket’s top ten whales,” panewslab.com, January 2026 That is still an edge, but it is not the 70-80% that a casual leaderboard glance suggests.

    Oracle manipulation is a real risk on the global Polymarket platform.

    In March 2025, a UMA token holder cast 5 million votes across three accounts to force a YES resolution on a $7 million Ukraine mineral deal market, despite no official agreement existing.9Yahoo Finance, “Polymarket Reports ‘Unprecedented’ Governance Attack by UMA Whale,” finance.yahoo.com, March 2025 In December 2025, a similar governance attack affected a $16 million UFO declassification market.10CryptoSlate, “Polymarket faces major credibility crisis after whales forced a YES UFO vote,” cryptoslate.com, December 2025

    These incidents do not mean every market is manipulable, but they demonstrate that on markets using token-weighted prediction market resolution mechanisms, a sufficiently capitalized actor can override consensus.

    Insider trading exists.

    Kalshi disclosed more than 200 investigations in the year through early 2026.11Kalshi, “Two Insider Cases We’ve Recently Closed,” news.kalshi.com, February 2026 Ahead of the February 28, 2026 US and Israeli strikes on Iran, researchers estimated that over 150 accounts correctly predicted the event, with at least 109 reportedly earning more than $10,000 each.12AInvest, “Polymarket Tightens Rules Amid Whale Wallets’ $143M Edge,” ainvest.com, April 2026 (citing unnamed researchers; figures are estimates)

    When the “smart money” signal you are following is actually insider information, your edge is not analysis. It is proximity to a source you do not have.

    Copy trading (generally) does not scale.

    The PANews research concluded that following whales without understanding their strategy is ineffective, because hedging and position management strategies that are invisible in raw trade data (such as over/under arbitrage in sports markets) make individual trades misleading in isolation.

    A top-20 Polymarket trader took a large YES position at $0.31 on a consensus-NO contract. 48 hours later, news broke and the contract jumped to $0.58. I started tracking moves like this systematically. Consistently profitable traders on Polymarket are right on contrarian positions about 60-65% of the time. That is enough edge to monitor, but not enough to follow blindly. The three times I tailed a whale without doing my own research, I lost twice.

    Robert C.

    The honest bottom line: smart money signals are a valuable input, not a trading strategy. They tell you where to look, not what to do.

    A Practical Framework for Interpreting Smart Money Signals

    Knowing the six signals is not enough. You need a decision framework that tells you when a signal warrants action, when it warrants attention, and when it is noise.

    Step 1: Identify the signal.

    Classify what you are seeing using the taxonomy from Section 2. A single whale trade is a different signal than multi-wallet convergence, and the appropriate response differs accordingly.

    Step 2: Verify the trader.

    On Polymarket, check the wallet’s leaderboard ranking, 30-day P&L (not all-time, which includes survivorship artifacts), win rate by category, and whether they specialize in the relevant market type. A politics specialist trading sports deserves less weight than their leaderboard rank suggests.

    Step 3: Check for a news catalyst.

    If the volume spike or whale trade coincides with public news, the signal has less informational value because the price adjustment may already be underway. The highest-value signals are the ones that precede public information.

    Step 4: Assess the contract’s liquidity and time to resolution.

    A whale trade on a thin market two months from resolution is ambiguous. The same trade on a deep market 72 hours from resolution is much more informative, because the trader is committing capital with limited time for the thesis to play out.

    Understanding how to evaluate a contract‘s fundamentals before acting on a signal is what separates informed trading from noise-chasing.

    Step 5: Size accordingly.

    Smart money signals are one input, not the entire thesis. Even the highest-reliability signal (multi-whale convergence without news catalyst) should not command your full position size. Effective bankroll management means capping signal-driven trades at a fraction of your total capital.

    PANews found one top whale’s adjusted win rate at roughly 53%, and sports betting sharps run about 55-60% long-term. These are edges, not certainties.

    Step 6: Set an exit before entry.

    Whale tracking tells you when to get in. It does not tell you when to get out. Before you enter a position based on smart money signals, define your exit: a price target, a time threshold, or a news event that would invalidate the thesis.

    The interplay between smart money signals and timing your trades around news cycles creates the strongest edge. Without a predefined exit, you are copying the entry without the strategy.

    Pro Tip

    The highest-value daily routine for smart money analysis is a 5-10 minute scan. Filter Polymarket’s leaderboard for 24-hour movers, check which contracts saw volume spikes without news catalysts, and note any convergence of top-100 wallets. Most days, you find nothing actionable. That is the correct outcome. Acting only when multiple signals align, rather than chasing every whale trade, is what separates informed traders from followers.

    Put the Signals to Work

    Smart money signals in prediction markets are not a shortcut. They are a lens, and the traders who profit from them are the ones who combine whale data with independent analysis, disciplined sizing, and honest assessment of the signal’s limits.

    Start with the sharp action concepts you already know from sports betting. Layer on the on-chain transparency that Polymarket provides. Build the daily scan habit: 5-10 minutes checking leaderboard movers, volume anomalies, and multi-wallet convergence. Most days, the answer is “do nothing.” That restraint is the strategy.

    If you are ready to put real capital behind smart money analysis, start on a platform where you can see the data.

    Sources & References

    • 1
      Polymarket, “Platform Overview,” polymarket.com, April 2026
    • 2
      VSiN, “Interpreting Line Movement to Locate Sharp Action,” vsin.com, January 2026
    • 3
      Finance Magnates, “Unusual Whales Extends Insider Radar to Prediction Markets,” financemagnates.com, January 2026
    • 4
      Kalshi, “API Documentation: Get Trades,” docs.kalshi.com, April 2026
    • 5
      Kalshi, “Leaderboard,” help.kalshi.com, April 2026
    • 6
      Kalshi, “Fee Schedule,” kalshi.com/docs/kalshi-fee-schedule.pdf, February 2026
    • 7
      Polymarket, “Trading Fees,” docs.polymarket.com/trading/fees, March 2026
    • 8
      PANews, “In-depth analysis of 27,000 trades by Polymarket’s top ten whales,” panewslab.com, January 2026
    • 9
      Yahoo Finance, “Polymarket Reports ‘Unprecedented’ Governance Attack by UMA Whale,” finance.yahoo.com, March 2025
    • 10
      CryptoSlate, “Polymarket faces major credibility crisis after whales forced a YES UFO vote,” cryptoslate.com, December 2025
    • 11
      Kalshi, “Two Insider Cases We’ve Recently Closed,” news.kalshi.com, February 2026
    • 12
      AInvest, “Polymarket Tightens Rules Amid Whale Wallets’ $143M Edge,” ainvest.com, April 2026 (citing unnamed researchers; figures are estimates)
  • Timing Your Prediction Market Trades: When to Buy, When to Wait

    Timing Your Prediction Market Trades: When to Buy, When to Wait

    Prediction market timing separates the traders who capture 178% on a CPI print from those who buy the same contract a day late and settle for 12%. Unlike sports betting, where you time your wager against the closing line, or stock trading, where technical patterns drive entry signals, prediction markets revolve around a different set of catalysts: scheduled data releases, political news cycles, contract expiration dates, and the behavioral patterns that emerge around each.

    The problem is that nobody teaches you when to enter. Every guide covers what prediction markets are and how contracts work. Almost none cover when to buy, when to wait, and when the crowd has already priced in the information you think gives you an edge.

    This guide builds a timing framework around four event types, walks through a real scheduled-data-release trade with dollar amounts and fees, and explains how approaching expiration creates opportunities that look a lot like options time decay. You will also learn to recognize the post-news overreaction pattern and know when to fade the crowd versus when to follow it.

    Why Prediction Market Timing Is Different From Sports Betting and Stock Trading

    Prediction market timing operates on a fundamentally different clock than either sports betting or equity trading. If you’ve timed a sports bet, you know the game: watch the line, identify value before the public floods in, and translate that instinct into reading prediction market odds effectively. Prediction markets share that DNA, but the catalysts driving price movement come from an entirely different source.

    In sports betting, the primary timing mechanism is the closing line, and the window between opener and tip-off is where all the value lives.

    In stock trading, timing usually means technical patterns, earnings calendars, or macro events. Prediction markets combine elements of both, then add a catalyst that neither has: a defined resolution date where the contract settles to exactly $1.00 or $0.00.

    FactorSports BettingStock TradingPrediction Markets
    Primary timing driverClosing line movementTechnical patterns, earningsScheduled catalysts, resolution date
    Information releaseInjury reports, lineup newsEarnings, Fed decisionsCPI, FOMC, GDP, election results
    Time horizonHours to daysMinutes to yearsDays to months
    “Time decay” analogVig increases near closeOptions thetaPrice polarization near resolution
    Can you exit early?Rarely (cash out on some books)YesYes (sell your position)

    That last row matters more than it first appears. Because you can sell your position before resolution, timing in prediction markets is not a single decision. There are, at minimum, two decisions: when to enter, and when to exit. This creates a strategic layer that sports bettors rarely encounter and that stock traders handle with stop-losses and profit targets.

    In prediction markets, the tools for managing those two decisions are the event type driving the contract and how close you are to resolution.

    The Four Event Types That Drive Prediction Market Prices

    Not all prediction market contracts move for the same reason, and your timing strategy should change based on the catalyst driving the price. These four event types cover virtually every contract you will encounter across all types of prediction markets.

    Event TypeExamplesEntry TimingKey SignalRisk Level
    Scheduled data releaseCPI, FOMC, GDP, jobs, earningsHours to days before releaseLeading indicators, consensus driftMedium (outcome uncertain, timing known)
    Election/politicalPresidential, congressional, policy votesWeeks to months before eventPolling shifts, endorsements, debate performanceHigh (long horizon, many variables)
    Breaking newsGov shutdowns, military action, CEO resignationsReactive onlySpeed of information vs. speed of marketVery high (emotional moves, thin liquidity)
    Gradual trend“Will BTC hit $X by year-end”Ongoing (thesis-driven)Trend confirmation, contrarian signalsMedium-low (slower moves)

    Scheduled data releases are the highest-probability timing opportunity in prediction markets because they combine two properties: you know exactly when the information arrives, and the market has usually priced in a consensus view you can evaluate independently. If you’ve traded options around earnings, the mechanics are similar, but prediction market contracts are simpler because the binary outcome eliminates multi-leg complexity.

    Election and political prediction markets require longer time horizons and carry more noise. The key timing insight is that political markets tend to overreact to individual polls and underreact to structural shifts. Entering after a polling-driven spike (when the crowd has just panic-bought or panic-sold) often yields better entries than chasing the initial move.

    Breaking news is where discipline matters most. You cannot time what you cannot predict. If a contract spikes 30 cents in 5 minutes on an unexpected headline, the worst move is to chase it. The best move is to wait for the emotional overshoot to correct, which it does more often than not, as covered in the overreaction section below.

    Gradual trend contracts reward patience over precision. Your edge comes from thesis quality, not entry timing.

    The Information Release Trade: A Step-by-Step Walkthrough

    The information release trade is the timing strategy with the clearest edge for intermediate traders, and it follows a repeatable pattern.

    Before sizing your position, evaluate the contract using a structured checklist to confirm the resolution criteria and liquidity are acceptable. Here is how it works using a CPI release trade as the example.

    Step 1: Identify the catalyst and date. The Bureau of Labor Statistics publishes CPI data on a fixed monthly schedule available on the BLS release calendar.1Bureau of Labor Statistics, “News Release Schedule,” bls.gov/schedule/, 2026 The date is public weeks in advance. You start by confirming the release date and understanding what consensus expects.

    Step 2: Form your independent view. Before the market prices in any last-minute drift, assess whether you believe the actual print will exceed, meet, or miss consensus. Leading indicators like the Cleveland Fed Nowcast, regional Fed surveys, and energy price trends give you data to build a thesis.

    Step 3: Evaluate the current contract price. If the market prices YES (CPI exceeds consensus) at $0.68, the implied probability is 68%. If your research suggests the real probability is closer to 40%, you have a 28-point gap. That gap, after fees and spread, is your potential edge.

    Expert Tip

    The sweet spot for information release trades is 24 to 72 hours before the data drops. Earlier than that, you are paying for uncertainty. Later than that, the market has absorbed most of the predictable consensus shifts.

    Step 4: Calculate your cost. On Kalshi, trading fees cap at $0.02 per contract for taker orders2Kalshi, “Fee Schedule,” kalshi.com/docs/kalshi-fee-schedule.pdf, February 2026, with makers paying roughly 25% of the taker rate3Kalshi, “Fee Schedule,” kalshi.com/docs/kalshi-fee-schedule.pdf, February 2026. If you buy 100 NO contracts at $0.32 each, your outlay is $32.00 plus up to $2.00 in fees ($34.00 total).

    On Polymarket’s US exchange, the taker fee is 0.30% on total contract premium4Polymarket, “Trading Fees,” docs.polymarket.com/trading/fees, March 2026, so the same 100 contracts at $0.32 would cost $0.10 in fees. The full fee comparison across platforms reveals how these differences compound over dozens of trades.

    Step 5: Size your position per your bankroll rules and enter.

    Step 6: Execute on resolution. The BLS publishes the number. If CPI comes in below consensus, NO resolves toward $1.00. On 100 contracts bought at $0.32, your gross return is $100.00 minus your $34.00 cost (Kalshi), leaving $66.00 in profit. Alternatively, you sell before resolution if the price spikes on the release and captures most of the move.

    Bought NO on CPI exceeding consensus, morning of the BLS release. Market priced YES at $0.68. My analysis of leading indicators said softer print. Bought NO at $0.32. CPI came in below consensus. NO jumped to $0.89 within minutes. Sold immediately for 178%. Scheduled data releases create the clearest timing opportunities because you know exactly when information arrives.

    Robert C.

    Time Decay and the Closing Market Opportunity

    If you have traded options, you already understand the core dynamic at work here. Options lose value as expiration approaches because uncertainty shrinks. Prediction market contracts behave similarly, though the mechanism is behavioral rather than mathematical.

    A contract trading at $0.55 six months from resolution carries heavy uncertainty. The crowd has weak conviction, and the price sits near the midpoint because traders are reluctant to lock capital into a position when too many unknowns remain. Academic research on prediction markets confirms this pattern: events far in the future show prices biased toward 50%, driven partly by traders’ time preferences.5Page, L. & Clemen, R., “Do Prediction Markets Produce Well-Calibrated Probability Forecasts?” The Economic Journal, 2013

    As resolution approaches, that uncertainty resolves. New information narrows the set of plausible outcomes. Prices polarize toward $0 or $1. A contract that sat at $0.55 for months might jump to $0.82 or drop to $0.25 in the final weeks as decisive information arrives. This polarization is the prediction market equivalent of options theta, and it creates two distinct timing opportunities.

    The early-conviction play:If you hold a strong thesis while the market is still uncertain (price near $0.50), you buy early and capture the polarization move as resolution approaches. You accept capital lockup in exchange for cheaper entry.
    The late-certainty play: If you wait until near resolution, you pay more (contract already near $0.80 or $0.20), but your probability of being right is higher because uncertainty has been resolved. This is particularly valuable on Kalshi’s Flash and 0DTE contracts6Kalshi, “Platform Overview and Market Features,” kalshi.com, March 2026, where the entire lifecycle plays out within hours.

    Pro Tip

    Contracts within 7 days of resolution that are still trading between $0.30 and $0.70 deserve extra scrutiny. The market is telling you something unusual is happening: either the event is genuinely uncertain, or the market is mispricing the final catalyst. Either scenario is a potential opportunity.

    The practical takeaway is straightforward: your timing horizon should match your thesis confidence. High confidence, far from resolution? Enter early. Low confidence but approaching a decisive catalyst? Wait.

    Post-News Overreaction: When the Crowd Gets It Wrong

    The most exploitable timing pattern in prediction markets is the overreaction to breaking news. It works like a steam move in sports betting: a wave of fast money pushes the price past fair value, and the correction that follows creates a window for disciplined traders.

    Here is the typical pattern. Unexpected news breaks. Traders pile into the obvious direction. A contract jumps from $0.45 to $0.72 in minutes. Social media amplifies the narrative. Then, as more careful analysis catches up, the market realizes the initial move overshot. The contract settles back to $0.63 or even lower. That 9-cent correction is a timing opportunity for anyone willing to wait for the emotional spike to burn off.

    The key question is how to distinguish an overreaction from a legitimate repricing. Two signals help:

    Volume profile. If the price spike comes on a burst of small retail orders rather than a few large informed trades, the move is more likely to correct. Thin prediction markets are especially vulnerable to overreaction because a single $500 order can move the price 5 to 10 cents.

    Information quality. An overreaction usually follows ambiguous or incomplete news. If the headline is “Sources say the Fed may cut rates” rather than “The Fed cuts rates by 50 bps,” the market is pricing uncertainty emotionally, not rationally.

    Warning

    Fading overreactions is not the same as catching a falling knife. If the news is definitively negative (a candidate drops out, a company misses earnings catastrophically), the initial move may be an underreaction, not an overreaction. The discipline is to wait for additional information before entering, not to reflexively bet against every spike.

    When you pair overreaction pattern recognition with the bankroll rules that keep any single trade from threatening your account, this becomes one of the most repeatable timing edges in prediction markets. The traders who lose money on this pattern are the ones who skip the evaluation step and chase the first price move they see, a habit that ranks among the most expensive mistakes new traders make.

    Build Your Timing Playbook

    Prediction market timing is not about predicting the unpredictable. It is about knowing which events create pricing opportunities, understanding how contracts behave as resolution approaches, and recognizing when the crowd has overreacted to incomplete information.

    Start with scheduled data releases. They are the highest-probability timing opportunity because the catalyst date is known, consensus views are public, and your edge comes from research rather than speed. As you build confidence, add the closing-market scan for contracts near resolution that the market has not yet fully priced, and develop your pattern recognition for post-news overreactions.

    The traders who time prediction markets well are not faster than everyone else. They are more disciplined about which events they trade and more patient about when they enter.

    Sources & References

    • 1
      Bureau of Labor Statistics, “News Release Schedule,” bls.gov/schedule/, 2026
    • 2
      Kalshi, “Fee Schedule,” kalshi.com/docs/kalshi-fee-schedule.pdf, February 2026
    • 3
      Kalshi, “Fee Schedule,” kalshi.com/docs/kalshi-fee-schedule.pdf, February 2026
    • 4
      Polymarket, “Trading Fees,” docs.polymarket.com/trading/fees, March 2026
    • 5
      Page, L. & Clemen, R., “Do Prediction Markets Produce Well-Calibrated Probability Forecasts?” The Economic Journal, 2013
    • 6
      Kalshi, “Platform Overview and Market Features,” kalshi.com, March 2026
  • How to Evaluate Any Prediction Market Contract in 5 Minutes

    How to Evaluate Any Prediction Market Contract in 5 Minutes

    Most prediction market losses start before the trade, not after it. The contract looked mispriced. The probability seemed off. You bought in, and then discovered the resolution criteria referenced a data source that didn’t measure what you thought it measured. Or the spread was so wide that your “edge” evaporated the moment you entered.

    Evaluating a prediction market contract takes less time than placing the trade itself, yet most traders skip it entirely. They check price, form an opinion, and click buy. Professional traders in any market, from equities to sports betting, run a pre-trade checklist. Prediction markets deserve the same discipline.

    This article gives you a 7-step evaluation framework you can apply to any contract on Kalshi, Polymarket, FanDuel Predicts, or any other platform in under five minutes. Each step targets a specific failure mode that costs real money. If a contract fails any step, you move on. No exceptions.

    Why Most Traders Skip Contract Evaluation (and Pay for It)

    Sports bettors spend minutes researching a game before placing a wager: checking injury reports, comparing lines across books, reviewing recent performance data. Traders who understand prediction market basics often still skip the one step that separates consistent profitability from expensive lessons. They see a price, disagree with it, and trade.


    The cost of that shortcut is specific and avoidable, ranking among the most expensive mistakes new prediction market traders make. Contract disputes on prediction markets arise almost exclusively from resolution ambiguity, not from market manipulation or platform failure.

    A contract asking “Will Company X exceed $10B in revenue?” sounds straightforward until you realize the resolution source uses GAAP revenue while the headline number in the earnings release uses non-GAAP. The event happened. The payout didn’t.

    Early in my prediction market trading, I jumped on a contract about whether a specific tech company would hit a revenue target by quarter-end. The price looked mispriced at $0.35. I bought 200 contracts. Two weeks later, the company announced earnings, beat the target, and the contract stayed at $0.40. The resolution criteria specified ‘as reported by Bloomberg Terminal,’ but the Bloomberg figure used a different revenue methodology than the company’s press release. I was right about the event. I was wrong about the contract. That $70 lesson taught me to read resolution criteria before reading the price.

    Robert C.

    A structured evaluation process eliminates these mistakes. The framework below works on any platform, any contract category, and takes under five minutes once you’ve internalized the steps. Treat it like a pre-flight checklist: every item gets checked, every time, regardless of how obvious the trade looks.

    The 7-Step Contract Evaluation Checklist

    Before committing capital to any prediction market contract, run through these seven checks in order. If a contract fails on any step, stop. Move to the next opportunity.

    1. Resolution source. What data source determines the outcome? Named, verifiable sources (AP, ESPN, BLS, CF Benchmarks) are trustworthy. “Community consensus” or unspecified sources are not.
    2. Contract wording. Does the question match your thesis exactly? Read the full resolution criteria, not just the headline question. One word can change the outcome.
    3. Volume. Has this contract traded enough to establish a reliable price signal? Low volume means the current price may not reflect informed consensus.
    4. Spread. What’s the gap between the best bid and best ask? If the spread exceeds your expected edge, the trade is unprofitable before it starts.
    5. Fee-adjusted edge. After platform fees, does your probability estimate still produce positive expected value? A 5-cent edge can become a 1-cent edge after costs.
    6. Time to expiration. How far out is resolution? Contracts within 48 hours behave differently than contracts weeks away. Price convergence accelerates near expiry.
    7. Go/no-go decision. Does this contract pass all six checks above? If yes, size the position appropriately. If any check failed, pass and look for the next setup.

    The rest of this article develops each step with worked examples and platform-specific context so you can apply the checklist immediately.

    Resolution Criteria: The Most Important 30 Seconds of Your Evaluation

    Resolution criteria determine whether you get paid, and they vary significantly across platforms. On Kalshi, contracts resolve against named third-party data sources: the Associated Press for election results, ESPN for sports outcomes, government data agencies for economic indicators, and CF Benchmarks for crypto price contracts.1Kalshi, “Platform Features & Resolution,” kalshi.com, March 2026 On Polymarket’s global platform, the UMA Optimistic Oracle handles resolution mechanics through a decentralized dispute mechanism where token holders vote on outcomes if the initial resolution is challenged.2Polymarket, “Platform Features & UX,” docs.polymarket.com, March 2026 FanDuel Predicts lists contracts through CME Group’s exchange infrastructure, with resolution tied to CME-defined contract specifications.3CME Group, “Prediction Markets,” cmegroup.com, March 2026

    These differences matter practically. A Kalshi contract resolving against an AP call produces a definitive, rapid result with no ambiguity. A Polymarket contract resolved through the UMA Oracle introduces a dispute window where the outcome can be challenged, potentially delaying settlement. Neither approach is inherently better, but each carries different risk profiles you should factor into your evaluation.

    What to look for in resolution criteria:

    Quality IndicatorGood SignRed Flag
    Data sourceNamed, specific (“BLS CPI report”)Vague (“general consensus”)
    Measurement definitionPrecise (“GAAP revenue as filed with SEC”)Ambiguous (“revenue exceeds $X”)
    TimingClear date or trigger (“by 11:59 PM ET, June 30”)Open-ended (“by end of year”)
    Dispute mechanismDefined process (UMA Oracle, exchange arbitration)Silent on disputes

    Expert Tip

    From an operator perspective, platforms invest heavily in resolution criteria design because disputes destroy user trust. Contracts citing specific, verifiable data sources (“Will the BLS report CPI above 3.0% for March 2026?”) are well-designed. Contracts with subjective criteria (“Will inflation be high?”) invite disputes. If you can’t identify the exact data source and the exact threshold, the contract fails Step 1.

    A contract with vague resolution criteria isn’t a trade. It’s a dispute waiting to happen.

    Liquidity, Spread, and Volume: Can You Actually Trade This?

    A mispriced contract with no liquidity isn’t an opportunity. It’s a trap. Before evaluating whether the price is wrong, confirm you can actually enter and exit the position at prices close to what you see on screen.

    Volume signals whether enough informed participants have traded to establish a meaningful price. A contract with $50 in total volume and a price of $0.45 is not “the market pricing in a 45% probability.” It’s one person’s opinion with no counterparty pressure.

    On high-volume political and sports markets, Polymarket produces tight spreads of 1 to 3 cents.4Polymarket, “Liquidity Assessment,” docs.polymarket.com, March 2026 Lower-volume markets on either platform can show spreads of 5 to 8 cents or wider. The spread functions similarly to the vig built into sportsbook pricing, except here you can see it in real time.

    Spread determines your real entry cost. If a YES contract shows an ask of $0.52 and a bid of $0.44, your 8-cent spread means you’re paying $0.52 to enter a position you could only immediately exit at $0.44. Your “edge” needs to exceed that 8-cent round-trip cost to be profitable.

    Spread RangeAssessmentAction
    1 to 3 centsTight. Normal for high-volume contracts.Proceed to fee analysis.
    4 to 6 centsAcceptable if your edge is significant.Only trade if your probability gap exceeds 10 cents.
    7+ centsWide. Likely low liquidity.Walk away unless you have exceptional conviction and can use limit orders.

    Pro Tip

    Use limit orders instead of market orders on contracts with spreads above 3 cents. You set your price rather than accepting the ask, which preserves your edge. Both Kalshi and Polymarket support limit orders through their order book interfaces.5Kalshi, “Trading Interface (CLOB),” docs.kalshi.com, March 2026

    Liquidity isn’t static. Check volume trends, not just the snapshot. A contract that traded $500 yesterday and $50 today is losing attention, which means the spread will likely widen further as you hold.

    Fee-Adjusted Edge: Does Your Trade Still Make Money After Costs?

    Your probability estimate says the contract is mispriced. The spread is acceptable. Now run the fee math, because a 5-cent edge can shrink to break-even depending on the platform and contract price.
    Fee structures differ meaningfully across the three major regulated platforms. Consider a $100 position (200 contracts at $0.50) where you believe the true probability is 60%, giving you a 10-cent expected edge per contract:

    PlatformFee CalculationFee on $100 PositionNet Edge/Contract
    Kalshi (general)round_up(0.07 x 200 x 0.50 x 0.50) = $3.50$3.50~$0.082
    Polymarket (global, politics 1.00%)Dynamic taker fee at $0.50 price~$2.50~$0.087
    Polymarket (global, crypto 1.80%)Dynamic taker fee at $0.50 price~$4.50~$0.077
    Polymarket US DCM0.30% x (200 x $0.50) = $0.30$0.30~$0.10
    FanDuel PredictsCME: $0.01 x 200 = $2.00 + FanDuel: 2% x $200 = $4.00$6.00~$0.07

    6Kalshi, “Fee Schedule,” kalshi.com/docs/kalshi-fee-schedule.pdf, February 20267Polymarket, “Trading Fees,” docs.polymarket.com/trading/fees, April 2026. Note: taker fees expanded to most categories effective March 30, 2026.8CME Group, “Event Contracts Fee Schedule,” cmegroup.com, February 2026; PokerNews, “FanDuel Predicts Review,” pokernews.com, 2026

    The same trade produces meaningfully different returns depending on where you execute it. On Polymarket’s US exchange, the 0.30% taker fee barely dents a 10-cent edge. On the global platform, category-dependent taker fees now range from 0.75% (sports) to 1.80% (crypto), making the cost picture more nuanced than the platform’s former zero-fee reputation suggests. On FanDuel Predicts, dual-layer fees consume 30% of your expected profit on this position size.

    Three rules for fee-adjusted evaluation:

    First, calculate your expected edge in cents per contract. Subtract the per-contract fee. If the result is negative or near zero, the trade isn’t worth the execution risk.

    Second, recognize that fee impact is price-dependent. Kalshi’s formula charges maximum fees at $0.50 (where P x (1-P) is maximized) per the platform’s published fee schedule and minimum fees near $0.00 or $1.00. If you’re trading contracts priced near the extremes, Kalshi’s fee impact drops substantially.

    Third, factor in round-trip costs. If you plan to sell before resolution rather than hold to expiry, double the entry fee for your cost estimate. Settlement is free on all three platforms, but early exits cost the entry fee again.

    Fee comparison alone doesn’t determine where to trade. A contract with tighter spreads on a higher-fee platform may net better execution than a zero-fee platform with wide spreads. Total cost of trading is fees plus spread, not either alone.

    Time, Timing, and When to Walk Away

    Time-to-expiration changes how a contract behaves. If you’ve traded options, the parallel is direct: prediction market contracts exhibit accelerating price convergence as resolution approaches, similar to theta decay. A contract trading at $0.55 with three weeks until resolution moves differently than the same contract at $0.55 with 48 hours left.

    With weeks remaining, new information can move the price in either direction. Your edge has time to play out, but so does the risk of an information event reversing your thesis. Within 48 hours, most contracts gravitate toward $0.00 or $1.00 as the outcome becomes increasingly clear. The remaining uncertainty compresses into a narrow window where prices can swing sharply on final news.

    Warning

    Contracts priced between $0.40 and $0.60 within 48 hours of resolution carry the highest volatility relative to their remaining time. The outcome is genuinely uncertain, and a single data release or news event can move the price 15 to 20 cents. This is where both the most edge and the most destruction live for active traders.

    I’ve watched dozens of contracts in the final 48 hours before resolution. The pattern is consistent: contracts above $0.85 barely move, because the outcome is essentially priced in. Contracts between $0.40 and $0.60 can swing 15 to 20 cents on a single news item. That volatility window is where edge lives for active traders, but it’s also where the most capital gets destroyed by late entries at bad prices.

    Robert C.

    Your go/no-go decision matrix:

    ScenarioAction
    All 6 checks passSize the position per your bankroll rules and trade.
    Resolution criteria unclearPass. No amount of edge compensates for payout uncertainty.
    Spread exceeds your edgeWatchlist. Set a limit order below the ask and wait.
    Fee-adjusted edge near zeroPass, or look for the same contract on a lower-fee platform.
    Time-to-expiry mismatchReassess position size. Shorter time = smaller position.

    Applying this checklist takes repetition before it becomes instinctive. The first five times feel slow. By the twentieth, it takes under five minutes and saves you from the trades that looked obvious but weren’t.

    Build the Evaluation Habit

    Every contract on every platform passes or fails the same seven tests. Resolution source, contract wording, volume, spread, fee-adjusted edge, time to expiration, and the final go/no-go. The checklist works because prediction market losses are predictable: they come from contracts with vague resolution criteria, illiquid order books, or edges too thin to survive fees.

    The traders who consistently profit in prediction markets aren’t the ones with better information. They’re the ones who avoid the trades that look good but aren’t. Discipline compounds. Every bad trade you skip protects capital for the ones that actually pay.

    If you’re ready to apply this framework, Kalshi, Polymarket, and FanDuel Predicts all offer contracts across politics, economics, sports, and more. Start with one contract, run the checklist, and build the habit before sizing up.

    Sources & References

    • 1
      Kalshi, “Platform Features & Resolution,” kalshi.com, March 2026
    • 2
      Polymarket, “Platform Features & UX,” docs.polymarket.com, March 2026
    • 3
      CME Group, “Prediction Markets,” cmegroup.com, March 2026
    • 4
      Polymarket, “Liquidity Assessment,” docs.polymarket.com, March 2026
    • 5
      Kalshi, “Trading Interface (CLOB),” docs.kalshi.com, March 2026
    • 6
      Kalshi, “Fee Schedule,” kalshi.com/docs/kalshi-fee-schedule.pdf, February 2026
    • 7
      Polymarket, “Trading Fees,” docs.polymarket.com/trading/fees, April 2026. Note: taker fees expanded to most categories effective March 30, 2026.
    • 8
      CME Group, “Event Contracts Fee Schedule,” cmegroup.com, February 2026; PokerNews, “FanDuel Predicts Review,” pokernews.com, 2026
  • The 9 Most Expensive Mistakes New Prediction Market Traders Make

    The 9 Most Expensive Mistakes New Prediction Market Traders Make

    Most new prediction market traders lose money on mistakes, not bad predictions. The prediction itself might be right. The contract resolves in your favor. But fees ate your edge, your capital was locked for months while better opportunities passed, or you doubled down after a loss and compounded the damage.

    Prediction markets are genuinely new for most people. Even experienced sports bettors and stock traders walk in with beginner prediction market mistakes that stem from assumptions that don’t transfer cleanly. The pricing mechanics are different. The fee structures are different. The fact that you can sell a position before resolution creates decision points that don’t exist in traditional betting.

    These nine mistakes span three categories: mechanical errors (fees, resolution, liquidity), strategic errors (bankroll concentration, capital lockup, exit planning), and psychological traps (confirmation bias, revenge trading, anchoring). Each one includes a specific dollar example showing exactly how much it costs, and a concrete fix you can apply immediately.

    Mechanical Mistakes: The Structural Errors That Cost You Before You Even Start

    Mistake 1: Ignoring Fee Impact on Your Edge

    Fees in prediction markets work differently than the vig on a sportsbook. They compound against your edge in ways most beginners never calculate. On Kalshi, the taker fee formula per Kalshi’s fee schedule is round_up(0.07 × C × P × (1 – P)), capped at $0.02 per contract.1Kalshi, “Kalshi Fee Schedule,” kalshi.com/docs/kalshi-fee-schedule.pdf, February 2026 That sounds small until you do the math.

    Say you buy 100 contracts at $0.50 because you believe the true probability is 57%. Your raw edge is 7 cents per contract, or $7.00 total. The Kalshi taker fee on this trade: round_up(0.07 × 100 × 0.50 × 0.50) = $1.75.2Kalshi, “Kalshi Fee Schedule,” kalshi.com/docs/kalshi-fee-schedule.pdf, February 2026 Your $7.00 edge just became $5.25. On a thinner edge of 3 cents per contract, fees consume more than half your expected profit, which is why the fee comparison changes at different position sizes.

    If you’re coming from sports betting, think of it this way: the vig is baked into the line, so you see your payout upfront. In prediction markets, the fee is a separate calculation that eats into a profit you’ve already mentally banked. Always run the fee math before you trade, not after.

    Mistake 2: Misunderstanding Resolution Rules

    Every prediction market contract lives or dies by its resolution criteria, and “close enough” doesn’t count. A contract asking “Will GDP growth exceed 2.5%?” resolves based on a specific data source (the BEA advance estimate, for example), on a specific date. If GDP comes in at 2.49%, your YES contract pays zero regardless of rounding debates.

    Resolution mechanisms also vary by platform. Kalshi uses centralized resolution through its own team under CFTC oversight.3CFTC, “Order of Designation: KalshiEX LLC,” cftc.gov, November 2020 Polymarket’s global platform uses the UMA Optimistic Oracle, a decentralized system where resolution can take longer and, in rare cases, face disputes.4Polymarket, “How Resolution Works,” docs.polymarket.com, March 2026 Reading the resolution criteria before trading is not optional. It is the single most important step most beginners skip.

    Mistake 3: Trading in Illiquid Markets

    Liquidity determines the real cost of your trade, not just the headline price. A contract showing $0.60 with a 10-cent spread between the best bid and ask means you’re paying $0.65 to buy and can only sell at $0.55. That 10-cent gap is an invisible 15% tax on every round trip.

    In poker, you’d never sit in a thin cash game where you can’t get action on your big hands. The same logic applies here: if a market doesn’t have enough depth for you to enter and exit at reasonable prices, the edge you think you see isn’t real. Check the order book depth before committing capital. Major markets on platforms like Kalshi and Polymarket show spreads of 2 to 5 cents on active contracts.5Kalshi, “Market Data,” kalshi.com, March 2026 If you’re seeing spreads above 10 cents, the market is too thin for meaningful position sizes.

    Strategic Mistakes: How Poor Planning Turns Winning Trades Into Losing Ones

    Mistake 4: Overconcentrating Your Bankroll

    Putting 30% of your prediction market bankroll into a single contract is the fastest way to blow up an account, even with a winning edge. The math is unforgiving. If you have $1,000 and place $300 on a contract at $0.40 (true probability you estimate at 55%), your expected value per contract is positive. But there’s still a 45% chance you lose the entire $300 in one shot.

    This is where sports bettors and poker players have an advantage if they apply what they already know. In tournament poker, no professional risks more than 2 to 5% of their bankroll on a single buy-in, and the same bankroll management principle applies to prediction markets. A 5% maximum per position means your $1,000 bankroll never puts more than $50 on any single contract. You survive the inevitable losing streaks and stay in the game long enough for your edge to compound.

    Mistake 5: Ignoring Opportunity Cost and Capital Lockup

    This is the mistake that separates prediction market trading from sports betting. When you bet on a game, the result comes in hours. In prediction markets, your capital can be locked for weeks or months.

    My most expensive prediction market mistake was ignoring opportunity cost. I put a generous sum into a contract at $0.78 that resolved YES three months later. A 27% return over 90 days sounds great on paper, but that $$$ was locked the whole time, and I missed multiple short-term opportunities that would have cycled that capital three or four times. Now I always factor in resolution timeline before sizing any position.

    Robert C.

    The fix is straightforward. Before entering any position, calculate the annualized return. An $0.80 contract paying $1.00 in six months is a 25% return, which annualizes to roughly 50%. That same $0.80 contract resolving in two weeks annualizes to over 600%. Time is a cost just like fees, and most beginners never price it in.

    Mistake 6: Trading Without an Exit Plan

    Prediction markets offer something traditional sports bets don’t: you can sell your position before the contract resolves. This creates a decision point most new traders ignore entirely. They buy a contract and default to “hold until resolution” without ever considering whether selling early at a profit might be the better move.

    Define your exit criteria before you enter the trade. At what price will you take profit? At what price will you cut losses to free up capital for better opportunities? If a contract you bought at $0.40 rises to $0.75, you’ve captured most of the upside. Holding for the final $0.25 means accepting the risk that new information could reverse the price, while your capital sits locked instead of working elsewhere.

    Psychological Mistakes: The Mental Traps That Destroy More Accounts Than Bad Predictions

    Mistake 7: Confirmation Bias in Your Research

    Confirmation bias is the tendency to seek out information that supports what you already believe, and ignore everything that contradicts it. In prediction markets, this plays out when you buy a YES contract and then only read news sources, social media accounts, and analysis that reinforces your position.

    The fix is deliberate and uncomfortable: after you form your thesis, spend equal time looking for the strongest argument against it. If you bought YES on a political outcome at $0.45, go find the most credible case for NO. If that case changes your probability estimate by more than 5 percentage points, your position size is wrong or the trade shouldn’t exist. The best poker players do this instinctively. They assign ranges to opponents, not single hands, and they update those ranges with every new card. Treat your prediction market research the same way.

    Mistake 8: Chasing Losses (Revenge Trading)

    After a loss, the impulse to immediately buy into another position to “win it back” is one of the most destructive patterns in any form of trading. In poker, this is called going on tilt, and it’s responsible for more busted bankrolls than bad cards.6Survey of Professional Forecasters, “Overconfidence Bias in Trading,” Federal Reserve Bank of Philadelphia, 2024

    After my first big loss on a political contract, I immediately bought into three other positions without doing any analysis. I was trying to ‘win it back.’ Two of those three lost as well. That triple loss in 48 hours taught me more about discipline than any winning streak ever could. Now I have a hard rule: no new trades for 24 hours after any single-position loss exceeding 5% of my bankroll.

    Robert C.

    Mistake 9: Anchoring to Your Purchase Price

    You bought a contract at $0.65. It drops to $0.45. You hold because “it was worth $0.65 before, so it will come back.” This is anchoring bias, and your purchase price is irrelevant to the contract’s current value.

    The only question that matters: at the current price of $0.45, what is the true probability of this event? If your honest assessment is 45% or lower, the contract is fairly priced or overpriced, and your capital is better deployed elsewhere. Holding a losing position because you paid more for it is the prediction market equivalent of throwing good money after bad. The market doesn’t know or care what you paid. Neither should you.

    Warning

    Revenge trading after a loss reduces decision quality dramatically. The emotional state that follows a loss is the worst possible state for making probability assessments. Step away. Review what went wrong. Return only when you can evaluate the next trade on its own merits.

    The 30-Second Pre-Trade Checklist

    Every mistake in this article can be caught with a quick check before you commit capital. Save this checklist and run through it before your first 50 trades. After that, it becomes instinct.

    Before every trade, ask yourself:

    1. Have I calculated my expected value including fees? If you can’t state your edge in cents per contract after fees, you’re guessing.
    2. Have I read the full resolution criteria? Do you know the exact data source, the exact date, and the exact threshold? If not, you don’t understand what you’re buying.
    3. Is there enough liquidity to exit? Check the order book. If the spread is wider than your expected edge, the trade is not worth taking.
    4. Am I risking more than 5% of my bankroll on this single position? If yes, reduce your size. No single trade justifies concentration risk.
    5. Have I factored in the resolution timeline? Calculate your annualized return. A 10% gain over six months is different from a 10% gain over two weeks.
    6. Am I entering this trade based on analysis or emotion? If you just took a loss, stop. Come back in 24 hours.
    7. Can I state the strongest argument against my position? If you can’t, your research is incomplete.

    Pro Tip

    Screenshot this checklist and keep it on your phone. Mechanical discipline beats emotional intelligence in the first 50 trades. Once these checks become habit, your error rate drops significantly.

    This checklist catches mistakes 1 through 9 in roughly 30 seconds. It won’t guarantee profitable trades, but it will eliminate the structural errors that bleed accounts dry before strategy ever gets a chance to work.

    Avoiding These Mistakes Won’t Make You a Great Trader. But It Will Stop You From Being a Bad One.

    Every trader makes mistakes early on. Prediction markets are new enough that even experienced sports bettors and stock traders walk in with blind spots. The difference between traders who survive their first six months and those who don’t isn’t prediction accuracy. It’s structural discipline.

    The mechanical mistakes (fees, resolution, liquidity) are the easiest to fix because they’re objective. Run the numbers. Read the criteria. Check the order book. The strategic mistakes (overconcentration, capital lockup, no exit plan) require more discipline but follow clear rules. The psychological mistakes (confirmation bias, revenge trading, anchoring) are the hardest because they feel rational in the moment.

    Start with the checklist. Use it for your first 50 trades. Pay attention to which mistakes you’re most prone to, and go deeper on the strategy that addresses your specific weakness.

    Sources & References

    • 1
      Kalshi, “Kalshi Fee Schedule,” kalshi.com/docs/kalshi-fee-schedule.pdf, February 2026
    • 2
      Kalshi, “Kalshi Fee Schedule,” kalshi.com/docs/kalshi-fee-schedule.pdf, February 2026
    • 3
      CFTC, “Order of Designation: KalshiEX LLC,” cftc.gov, November 2020
    • 4
      Polymarket, “How Resolution Works,” docs.polymarket.com, March 2026
    • 5
      Kalshi, “Market Data,” kalshi.com, March 2026
    • 6
      Survey of Professional Forecasters, “Overconfidence Bias in Trading,” Federal Reserve Bank of Philadelphia, 2024
  • Prediction Market Bankroll Management: A Sports Bettor’s Guide to Position Sizing

    Prediction Market Bankroll Management: A Sports Bettor’s Guide to Position Sizing

    Your sports betting bankroll rules will lose you money in prediction markets. Not because the principles are wrong, but because the mechanics are different in ways that quietly change the math.

    Prediction market bankroll management requires adjustments that most sports bettors don’t see coming. Your capital gets locked for weeks instead of hours. You can sell a position before resolution (a second decision point that doesn’t exist in sports). And your “diversified” positions across politics, economics, and crypto might all move on the same headline.

    The core discipline transfers: never risk enough on a single trade to threaten your account. But the sizing formulas, the correlation math, and the capital allocation all need recalibration. This guide covers three approaches to PM position sizing, explains why Kelly Criterion works better for prediction markets than for sports, and gives you specific rules for managing correlated exposure.

    Why Sports Bankroll Rules Need Adjusting for Prediction Markets

    If you manage a sports betting bankroll, you already understand the most important rule: size your bets so that no single loss threatens your account. That principle carries over to prediction markets unchanged. What doesn’t carry over is the math behind your sizing.

    Three differences force the adjustment.

    Your capital stays locked longer. A $100 NFL moneyline bet resolves in three hours. A $100 prediction market contract on a Fed rate decision might not resolve for six weeks. During those six weeks, that $100 is unavailable for other trades. If you have $2,000 in your account and $800 is locked in positions expiring next month, you size new trades against the $1,200 that’s actually available, not the full $2,000.

    You can sell before resolution. Sports bets are binary: you wait for the final score. Prediction market positions can be sold on the open market at any time before the event resolves. This creates a second decision point: hold to resolution or sell at the current price. That option has value, and deciding when to sell is its own exit strategy discipline. A larger position becomes more defensible when you know you can exit if new information shifts the odds.

    Correlation hides across categories. In sports betting, a five-team parlay is obviously correlated because you chose to link the bets. In prediction markets, correlation is less visible. Five separate contracts on “Will the Fed cut rates?”, “Will inflation drop below 3%?”, “Will the S&P 500 reach 6,000?”, “Will unemployment stay below 4%?”, and “Will GDP growth exceed 2.5%?” look like diversification across five markets. They’re not. All five respond to the same macroeconomic conditions. That’s a hidden parlay.

    Sports Bankroll vs. Prediction Market Bankroll: Key Differences

    FactorSports BettingPrediction Markets
    Resolution timeHours (game ends)Days to months (event resolves)
    Capital availabilityRecycled same dayLocked until resolution or sale
    Exit optionNone (bet is placed)Sell position on open market
    Correlation visibilityObvious (parlays are labeled)Hidden (separate contracts, same drivers)
    Sizing baseFull bankrollAvailable bankroll minus locked positions

    Three Approaches to Sizing Your Prediction Market Positions

    Sports bettors have a universal sizing language: bet in units, typically 1-3% of your bankroll per wager. Prediction market position sizing offers three distinct approaches, each with different strengths depending on your experience and how many trades you’re making.

    Fixed percentage is the simplest. Pick a number (2-3% is standard for PM trading, same as sports) and risk that amount on every trade. On a $5,000 account, that’s $100 to $150 per position. The advantage is consistency: you never need to calculate anything beyond basic multiplication. The disadvantage is that you treat a 52% edge the same as a 15% edge, leaving money on the table when your conviction is high and overexposing when your edge is thin.

    Kelly Criterion sizes each trade based on your estimated edge. The formula tells you to bet more when your probability assessment differs significantly from the market price and less when the edge is slim. Prediction markets make Kelly more practical than sports betting because the contract price IS the market’s probability estimate. You don’t need to reverse-engineer implied probability from American odds. We’ll walk through the full calculation in the next section.

    Portfolio allocation treats your prediction market account as a diversified portfolio rather than a series of individual bets. Instead of asking “how much should I bet on this contract?”, you ask “what percentage of my total capital should be allocated to economic events, political events, and sports events?” This approach works best for active traders running 10 or more simultaneous positions.

    Three Approaches Compared

    ApproachFormulaPM Example ($5K)Best ForWeakness
    Fixed %2-3% of bankroll per trade$100-$150 per contractBeginners, low trade volumeIgnores edge size
    Kelly Criterionf* = (p – price) / (1 – price)Varies by edge (see worked example)Intermediate traders with tracked recordsRequires accurate probability estimates
    Portfolio AllocationCategory caps (e.g., 30% politics, 30% econ, 20% sports, 20% other)$1,500 max per categoryActive traders with 10+ positionsComplex to manage, rebalancing overhead

    Start with fixed percentage. It’s the same discipline you already use in sports. Graduate to Kelly once you’ve tracked at least 50 trades and can verify your probability estimates are well-calibrated.

    Kelly Criterion for Prediction Markets: A Worked Example

    The Kelly Criterion was developed by Bell Labs researcher John Kelly in 1956 to optimize bet sizing for maximum long-term growth.1J.L. Kelly Jr., “A New Interpretation of Information Rate,” Bell System Technical Journal, 1956 It works more cleanly for prediction markets than for any other betting domain because contract prices hand you one of the two inputs you need.

    Here’s the formula adapted for binary PM contracts:

    Kelly fraction = (your probability estimate − contract price) / (1 − contract price)

    Suppose you find a contract trading at $0.40 (the market says 40% probability). You’ve done your research and believe the true probability is 55%. Your Kelly fraction is:

    f* = (0.55 − 0.40) / (1 − 0.40) = 0.15 / 0.60 = 0.25 (25%)

    On a $5,000 bankroll, full Kelly says to risk $1,250. That’s a massive position, and it illustrates why experienced traders almost never use full Kelly.

    The problem with full Kelly is that it assumes your probability estimate is perfect. It’s not. If the true probability turns out to be 45% instead of 55%, you’ve massively oversized a losing trade. Full Kelly also produces stomach-churning drawdowns: research shows it can produce 50% or greater peak-to-trough drops even when your long-term edge is real.2Edward O. Thorp, “The Kelly Criterion in Blackjack, Sports Betting, and the Stock Market,” Handbook of Asset and Liability Management, 2006

    Full Kelly vs. Fractional Kelly

    FractionPosition Size ($5K)Growth RateMax Drawdown RiskEmotional Experience
    Full Kelly (100%)$1,250Maximum theoretical50%+ drawdowns likelyBrutal. Most people quit.
    Half Kelly (50%)$625~75% of full Kelly growthSignificantly reducedManageable for experienced traders
    Quarter Kelly (25%)$312.50~50% of full Kelly growthModest drawdownsComfortable for most people

    Half Kelly is the sweet spot for most prediction market traders. You sacrifice roughly 25% of long-term growth rate in exchange for dramatically smoother results.3Edward O. Thorp, “The Kelly Criterion in Blackjack, Sports Betting, and the Stock Market,” Handbook of Asset and Liability Management, 2006 Quarter Kelly is appropriate when you’re less confident in your estimate or when the market is thin enough that your entry might move the price.

    Notice the advantage prediction markets offer here: the contract price at $0.40 tells you directly that the market estimates 40% probability. In sports betting, you’d need to strip the vig from the odds to understand prediction market odds and find implied probability. PM contract prices hand you a cleaner baseline for the Kelly calculation.

    Correlation Risk: Why Five “Yes” Positions Isn’t Diversification

    If you’ve ever placed a same-game parlay in sports betting, you understand correlation intuitively. When you parlay the Chiefs moneyline with Travis Kelce over 5.5 receptions and over 48.5 total points, those outcomes are linked. If the Chiefs are winning big, Kelce is probably catching passes, and the total is probably going over. That’s why the parlay pays more: the bookmaker knows the legs aren’t independent.

    Prediction market correlation works the same way but is harder to spot. Your positions don’t come labeled as a parlay. They sit in separate markets with separate contracts. But the underlying drivers can be identical.

    Consider these five positions held simultaneously: “Fed cuts rates in June” (YES at $0.45), “CPI falls below 3%” (YES at $0.55), “S&P 500 reaches 6,000” (YES at $0.35), “Unemployment stays below 4%” (YES at $0.62), and “GDP growth exceeds 2.5%” (YES at $0.48). Five contracts across three different categories (economics, finance, news). Looks diversified. It’s not.

    All five positions win in the same scenario: the economy stays strong while inflation cools. All five positions lose in the same scenario: inflation spikes, forcing the Fed to hold or raise rates. One bad CPI report could move all five contracts against you simultaneously. If you’ve put 5% of your bankroll in each, you haven’t risked 5%. You’ve risked 25% on a single macroeconomic outcome.

    The fix is a correlated exposure cap. Group your positions by their primary driver, not by their market category. Set a maximum allocation per driver group. A reasonable starting point: no more than 15-20% of your bankroll exposed to positions that share a primary driver. This means that if you already hold $750 in “soft landing” positions on a $5,000 account (15%), your next Fed-related contract needs to wait until one resolves or you sell a position.

    When to Cut Your Position Size

    Knowing your default sizing rule is half the equation. The other half is knowing when to go smaller. Here are six specific triggers that should reduce your position size below your standard allocation.

    Thin liquidity. If buying $200 worth of contracts would move the price by more than 2 cents, the market is too thin for that position size. Check the order book depth before entering. Thin markets also make selling harder if you need to exit before resolution.

    Long timeline to resolution. A contract resolving in two weeks locks your capital briefly. A contract resolving in six months locks it for half a year. Size longer-dated positions smaller to account for the opportunity cost: that capital can’t be redeployed if a better opportunity appears next week.

    High correlation with existing positions. If you already hold exposure to a macro driver and a new opportunity has the same underlying thesis, cut the new position to stay within your correlated exposure cap.

    Low confidence in your estimate. Kelly-style sizing naturally adjusts for this: smaller edge = smaller position. But even with fixed percentage sizing, you should distinguish between “I’ve spent 10 hours researching this and I’m confident the market is wrong” and “I have a hunch.” Size accordingly.

    You’re in a drawdown. If your account is down 15% or more from its peak, reduce all position sizes by half until you recover. Drawdowns compound: a 20% loss requires a 25% gain to break even. Smaller positions during drawdowns protect your ability to stay in the game.

    The fee eats your edge. On small positions, trading fees can consume a meaningful percentage of your expected profit. If fees on a trade represent more than 20% of your expected value, checking platform fee schedules confirms the position isn’t worth taking at that size.

    Coming from poker, I adapted buy-in thinking for prediction markets. My rule: never more than 5% of my PM bankroll in a single contract, never more than 20% in correlated positions. On a $5,000 account, max single position is $250, max correlated exposure is $1,000. I’ve broken both rules exactly once. The single-position rule cost me $380 on a political contract I was certain about. ‘Certain’ turned out to be worth about 60%. The correlated exposure violation was during the 2024 election: I had five election-adjacent positions that all moved against me on the same polling shift. Lessons I should have already known from poker, relearned the expensive way.

    Robert C.

    Start Simple, Size Smart

    The best prediction market bankroll management system is the one you actually follow. Fixed percentage sizing (2-3% per trade) gives you a reliable floor. Kelly Criterion lets you size up when your edge is real and scale down when it’s marginal. Portfolio allocation keeps you from accidentally concentrating on a single economic thesis.

    Whatever approach you choose, the three rules that matter most are the same ones that matter in sports betting: never risk enough on one trade to threaten your account, recognize when your positions are correlated, and cut your size when conditions aren’t ideal. The adjustment for prediction markets is understanding that your capital stays locked longer and that selling before resolution is a tool, not a failure.

    Sources & References

    • 1
      J.L. Kelly Jr., “A New Interpretation of Information Rate,” Bell System Technical Journal, 1956
    • 2
      Edward O. Thorp, “The Kelly Criterion in Blackjack, Sports Betting, and the Stock Market,” Handbook of Asset and Liability Management, 2006
    • 3
      Edward O. Thorp, “The Kelly Criterion in Blackjack, Sports Betting, and the Stock Market,” Handbook of Asset and Liability Management, 2006
  • Prediction Market Odds, Pair Pricing, and Probability: How to Read the Numbers That Drive Every Trade

    Prediction Market Odds, Pair Pricing, and Probability: How to Read the Numbers That Drive Every Trade

    A prediction market contract priced at 65 cents is telling you something specific: the crowd puts the probability at exactly 65%. That single number is the entire pricing system. 1Polymarket Help Center, “What is a Prediction Market,” help.polymarket.com, March 2026

    If you have traded stocks, placed a sports bet, or even checked an election forecast, you already understand the core mechanic. Prediction markets express probability as a price between $0.01 and $0.99, where every cent equals one percentage point of likelihood. A contract at $0.80 means an 80% chance. A contract at $0.25 means 25%. No conversion needed.

    The challenge is that sports bettors think in American odds, traders think in decimals, and prediction markets speak in cents. This guide bridges those languages. You will see how YES/NO pair pricing works, how to translate PM prices into any odds format you already use, and how that translation skill helps you spot value across platforms.

    Price Equals Probability: The One Rule That Unlocks Everything

    Prediction market odds work through a simple mechanism: the contract price is the implied probability. 2Kalshi, “How Kalshi Works,” kalshi.com, March 2026 A contract trading at $0.65 on the question “Will the Fed cut rates in June 2026?” means the collective market assigns a 65% chance to that rate cut happening. If the Fed does cut rates, the contract pays $1.00. If it does not, the contract pays $0.00.

    The math is transparent. Buy that contract at $0.65, and you stand to gain $0.35 if you are right (the $1.00 payout minus your $0.65 cost). Your maximum loss is $0.65, the exact amount you paid. That $1.00 ceiling and $0.00 floor mean your risk is bounded on both sides, with no margin calls, no hidden leverage, and no scenario where you owe more than your initial stake.This bounded structure is one of the key differences between prediction markets and other trading instruments.

    For a full explanation of contract mechanics, see our guide to how prediction markets work.

    Pro Tip:

    If a prediction market contract costs $0.70, the market is saying there is a 70% chance this event happens. Your job is to decide whether you agree with that number.

    YES, NO, and the Spread: How Pair Pricing Works

    Every prediction market question creates two contracts: YES and NO. These are two sides of the same coin, and understanding how they pair together is central to reading prediction market contracts. If YES costs $0.65, the NO contract for that same question costs approximately $0.35. The two prices sum to roughly $1.00, because exactly one outcome will pay out. 3Polymarket Documentation, “What is a Prediction Market,” docs.polymarket.com, March 2026

    The word “roughly” matters. In practice, YES + NO usually adds up to slightly more than $1.00. That difference is the spread. It represents the cost of trading on that platform, similar to the vig or juice at a sportsbook. A $0.65 YES paired with a $0.36 NO totals $1.01. That extra cent is the platform’s built-in margin.


    Market Question

    YES Price

    NO Price

    Combined

    Fed cuts rates in June 2026?

    $0.65

    $0.36

    $1.01

    Lakers win NBA Championship?

    $0.12

    $0.89

    $1.01

    Bitcoin above $100K by Dec 2026?

    $0.55

    $0.46

    $1.01

    The spread varies by platform and by market. High-volume markets on Polymarket can have spreads as tight as 1 to 2 cents ($1.01 combined). 4DeFi Rate, “The Hidden Tax Inside Your Prediction Market App: March Madness Odds Compared,” defirate.com, March 2026 Lower-volume markets on smaller platforms can see spreads of 5 to 8 cents ($1.05 to $1.08 combined). Checking the YES + NO combined price before you trade tells you exactly how much the platform is extracting.

    Expert Tip:

    Before buying a contract, add the YES price and the NO price together. If they sum to $1.05 or higher, you are paying a 5%+ spread. Compare that to another platform offering the same market at $1.01 combined. On high-volume trades, the spread difference adds up fast.

    The Odds Translation Table: PM Prices in Every Format You Already Know

    Prediction market prices are just another way of expressing odds. If you have placed a moneyline bet at a sportsbook, you have already done this math in reverse. The table below translates prediction market contract prices into implied probability, American odds, and decimal odds, with the corresponding NO price for each. 5OddsJam, “Prediction Market to Betting Odds Converter,” oddsjam.com, March 2026


    PM Price (YES)

    Implied Probability

    American Odds

    Decimal Odds

    PM Price (NO)
    $0.9090%-9001.11$0.10
    $0.7575%-3001.33$0.25
    $0.6565%-1861.54$0.35
    $0.5050%+1002.00$0.50
    $0.3535%+1862.86$0.65
    $0.2020%+4005.00$0.80

    The conversion formulas are straightforward. For contracts priced above $0.50 (favorites), American odds equal the negative of (price times 100) divided by (1 minus the price). For contracts below $0.50 (underdogs), American odds equal (1 minus the price) divided by the price, times 100. 6Prediction Hunt, “Prediction Market Odds Converter,” predictionhunt.com, March 2026 Decimal odds are simply 1 divided by the contract price.

    The practical takeaway: a $0.65 PM contract is equivalent to -186 American odds. If a sportsbook is offering -150 on the same event, the sportsbook is giving you a better price (it implies only 60% probability versus the PM’s 65%). That gap is your signal to compare platforms before placing a trade.

    For Sports Bettors: Quick Translation Cheat Sheet

    Think of PM contract prices as the “implied probability” you already calculate from moneylines. A $0.50 contract = +100 (even money). Above $0.50 = a favorite (negative American odds). Below $0.50 = an underdog (positive American odds). The deeper below $0.50, the bigger the potential payout and the bigger the longshot. If you are comfortable evaluating -200 versus -180 at different sportsbooks, you already have the skill to compare $0.67 versus $0.64 on different prediction markets.For more on applying your sports betting background to prediction markets, see our sports bettor’s guide to prediction markets.

    Why Prediction Market Prices Move (and How That Differs From a Sportsbook)

    At a traditional sportsbook, a team of oddsmakers sets the opening line. They adjust it based on where the money flows, but the house controls the starting point and the magnitude of changes. Prediction markets work differently. There is no bookmaker. Prices form entirely through supply and demand on an order book, similar to how stock prices form on an exchange. Platforms like Kalshi operate as CFTC-regulated designated contract markets, meaning the exchange infrastructure meets federal standards for transparency and oversight. 7Kalshi, “Trading on Kalshi,” help.kalshi.com, March 2026

    When more traders buy YES contracts, the YES price rises. When sellers dominate, the price falls. Both Kalshi and Polymarket use central limit order books (CLOBs) where buyers post bids and sellers post asks. 8Polymarket Documentation, “How Trading Works,” docs.polymarket.com, March 2026 When a bid matches an ask, a trade executes. The spread between the highest bid and lowest ask reflects market liquidity. Tight spreads (one or two cents between the best bid and best ask) mean you can enter and exit positions cheaply.

    This structure has a practical consequence: prediction market prices update in seconds when new information emerges. During live events, contract prices swing in real time as traders react to each development. Traditional polls take days to reflect new information. Sportsbooks adjust lines within minutes but often lag behind sharp bettors. Prediction markets close that gap because every participant is incentivized to act on new information immediately.

    Warning:

    Fast-moving prices during live events can mean wider spreads and more slippage. If you are trading a contract while news is breaking, use limit orders instead of market orders to control the price you pay.

    How Sports Bettors Can Spot Value Using Odds Translation

    The skill that makes a profitable sports bettor transfers directly to prediction markets: finding prices that do not reflect the true probability. 9DeFi Rate, “The Hidden Tax Inside Your Prediction Market App: March Madness Odds Compared,” defirate.com, March 2026 On a sportsbook, you look for a +150 underdog you believe should be +120. On a prediction market, you look for a $0.40 contract on an event you believe has a 55% chance of occurring.

    The translation table from the previous section is your tool for cross-platform comparison. If a contract on Kalshi is priced at $0.65 and a sportsbook lists the same event at -150 (implied 60% probability), the prediction market is pricing the event 5 percentage points higher. Your job is to determine which price is closer to reality. If your research supports the 60% number, the sportsbook offers better value. If you believe 65% or higher is accurate, the PM price is fair. 10Kalshi Fee Schedule, effective February 5, 2026, kalshi.com/docs/kalshi-fee-schedule.pdf

    One additional factor to consider: prediction markets also host multiple-outcome markets. Instead of a binary YES/NO, a question like “Who will win the 2028 Presidential Election?” might have 8 to 10 candidates, each priced individually. All outcome prices should sum to approximately $1.00 (plus the platform’s overround). If you spot individual candidates mispriced within that structure, the same value-identification logic applies, just across more options.

     I spotted a political contract trading at $0.40 (equivalent to +150 in sports betting terms). My research suggested the true probability was closer to 55%. In sports betting language, that is like getting +150 odds on what should be a -122 favorite. That gap is where the edge lives. The key was translating between formats so I could recognize the mispricing immediately, rather than treating the PM price as an unfamiliar number.

    Robert C.

    Reading the Numbers, Finding the Edge

    Prediction market odds are simpler than they first appear. Price equals probability. YES and NO form a pair that sums to approximately $1.00. Every PM price has a direct equivalent in American odds, decimal odds, and implied probability. Once you internalize these translations, you can compare prices across prediction markets and sportsbooks with the same speed you compare lines at DraftKings versus FanDuel.

    The edge comes from applying what you already know. If you are a sports bettor, you have spent years identifying mispriced lines. That skill works identically here, with the added advantage that prediction markets cover politics, economics, entertainment, and dozens of other categories where sportsbooks do not operate. Start by reading prices in the format you know best, then build fluency in the PM-native format as you gain experience.

    Risk Warning:

    Prediction markets involve financial risk. Only trade with money you can afford to lose. Past performance does not guarantee future results. Check your local regulations before trading on any prediction market platform.

    New to prediction markets entirely? Start with our complete guide to how prediction markets work for the full foundation.

    Sources & References

    • 1
      Polymarket Help Center, “What is a Prediction Market,” help.polymarket.com, March 2026
    • 2
      Kalshi, “How Kalshi Works,” kalshi.com, March 2026
    • 3
      Polymarket Documentation, “What is a Prediction Market,” docs.polymarket.com, March 2026
    • 4
      DeFi Rate, “The Hidden Tax Inside Your Prediction Market App: March Madness Odds Compared,” defirate.com, March 2026
    • 5
      OddsJam, “Prediction Market to Betting Odds Converter,” oddsjam.com, March 2026
    • 6
      Prediction Hunt, “Prediction Market Odds Converter,” predictionhunt.com, March 2026
    • 7
      Kalshi, “Trading on Kalshi,” help.kalshi.com, March 2026
    • 8
      Polymarket Documentation, “How Trading Works,” docs.polymarket.com, March 2026
    • 9
      DeFi Rate, “The Hidden Tax Inside Your Prediction Market App: March Madness Odds Compared,” defirate.com, March 2026
    • 10
      Kalshi Fee Schedule, effective February 5, 2026, kalshi.com/docs/kalshi-fee-schedule.pdf